If you do analytics in R there two most convenient ways to share the results of your research and collaboRate: R-Markdown and Shiny.
R-Markdown is perfect for 1-way interaction, while Shiny is 2-way. In the post below I will describe main steps you need to complete to run you service based on the example of my forecasting service
Develop your app
First of all, you need to create 2 files: ui.R and server.R. First file will control the layout and appearance of your app, second will tell a computer what to do with input. Then you need to install and run Shiny package:
install.packages("shiny")
library(shiny)
You can have a bunch of options how to build UI, however I prefer shinydashboard. You can develop really beautiful reports, something like this one. So you need to activate shinydashboard by running:
install.packages("shinydashboard")
library(shinydashboard)
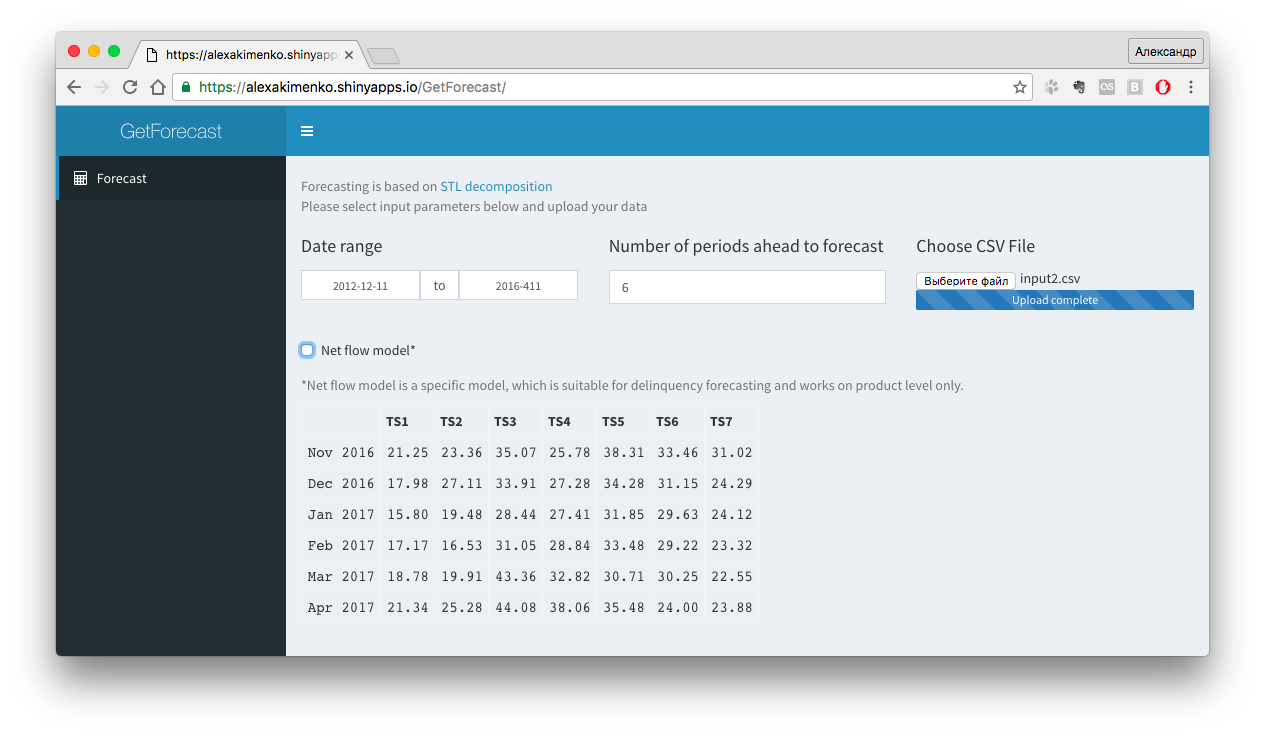
Next you need to fill dashboardHeader, dashboardSidebar and dashboardBody. In dashboardBody we will have input elements to communicate with the user - dateRangeInput (range of the dates from a file with actuals), numericInput (Number of periods ahead to forecast) and fileInput (actual). We also have checkboxInput just to specify forecasting model type. Each input element has at least 3 parts: variable name (it will be used in server.R part), help text and default value. Below you can see the full script of ui.R part
dashboardPage(skin = "blue",
              dashboardHeader(title = "GetForecast"),
              dashboardSidebar(
                sidebarMenu(
                  menuItem("Forecast", tabName = "forecast", icon = icon("calculator"))
                )
              ),
              dashboardBody(
                tabItems(
                  tabItem(tabName = "forecast",
                          helpText( "Forecasting is based on ",  a("STL decomposition",     href="https://www.otexts.org/fpp/6/5",target="_blank"),br(),
                                    "Please select input parameters below and upload your data"),
                          p(),
                          fluidRow(
                            column(4,
                              dateRangeInput("dates", label = h4("Date range"))),
                            column(4,
                              numericInput("n.ahead", label = h4("Number of periods ahead to forecast"), value = 6)),
                            column(4,
                              fileInput('file1', h4('Choose CSV File'),
                                      accept=c('text/csv',
                                               'text/comma-separated-values,text/plain',
                                               '.csv')))),
                            checkboxInput("nf_model_flag", label = "Net flow model*", value = F),
                            helpText("*Net flow model is a specific model, which is suitable for delinquency forecasting and works on product level only."),
                            h4("Forecast"),
                            tableOutput('contents')
                          )
                      )
                  )
              )
All your calculations in server.R part should be inside shinyServer function:
shinyServer(function(input, output) {})
However before developing server.R you need to understand the concept of reactivity. You can think of it as of Excel table, where if you change value in one sell other linked cell will be changed automatically. And unfortunately you need to explicitly tell Shiny to if you want your functions to be reactive. You can do it with reactive or render functions. Here is the example:
output$contents <- renderTable({
  n.ahead<-input$n.ahead
  v<-data()
  if (is.null(v))
    return(NULL)
  if (input$nf_model_flag==T){
    ts<-net_flow_model(v,n.ahead)
  } else {
    ts<-standart_model(v,n.ahead)
  }
  data.frame(ts)
})
Thus the function above takes input$n.ahead as input from ui.R, result of reactive data() function, calculates ts and returns data.frame(ts), which we output in ui.R with tableOutput('contents') function.
Deploy your app
If you are a beginner, most convenient way is to run your apps on shinyapps.io. I won’t describe all the process of deployment - it is available on Shiny page. If you deploy the app for the first time you need to create shinyapps.io account and link it with your R-Studio via rsconnect package and be ready for errors:) Most common error is that one of the dependency is missing in your app. It can be uninstalled package or data, which was not stored in Shiny app folder. So not to be overwhelmed I suggest to start with the deployment of a simple example available in the tutorial on Shiny page